The 7 Quality Management Tools With 3D Scanning: Real Data From Your Plant
The 7 quality management tools are the check sheet, the histogram, the Pareto chart, the cause-and-effect (Ishikawa) diagram, the scatter diagram, the control chart and stratification. All seven do the same job: they organize data so a team can see a pattern and decide. None of them generates the data. That makes their output entirely dependent on what goes in — and in a working plant, the weakest input is almost always geometric: where each machine, line and structure actually sits today.
That is where 3D laser scanning comes in. A point cloud captures the facility exactly as it was built, to an accuracy of ±2 to 10 mm, and turns “we think it’s level” into a measurement anyone can audit. It is precisely what ISO 9001 asks for when it calls for evidence-based decision making and for monitoring and measuring resources that fit the verification being done. Working from that capture, Foundtech reports up to 22% higher operational efficiency and 35% fewer reworks.
An 8-minute read. By the end you will know what the 7 tools are, which piece of data each one is missing in an industrial setting, and how 3D scanning solves it.
Looking at a problem and measuring it are not the same thing: the first leaves an impression, the second leaves a number anyone can verify. And all seven classic quality tools run on measurements, not impressions.
The symptom is easy to spot. An Ishikawa diagram where the “Measurement” branch fills up with cards that begin with “possible.” A control chart fed by tape-measure readings taken by three different people across three different shifts. A Pareto chart that ranks reported defects rather than detected ones. In all three cases the tool is working exactly as designed. The problem is that it is organizing data nobody measured with any rigor, and a well-charted decision built on a weak number is still a weak decision.
At Foundtech we work on that exact link in the chain. We capture the reality of industrial facilities with millimeter precision and turn it into digital models that quality, maintenance and project teams can consult without walking the floor again to verify. We have done it across more than 200 projects in Europe and the Americas, with over 10 million m² modeled under ISO 19650 certification and alongside our Swiss sister company BIM Facility AG. This article does not propose changing your quality tools. It proposes changing what you feed them.
The 7 tools do not produce data — they organize it
Worth settling the list before arguing about it. According to the American Society for Quality (ASQ), the seven basic quality tools are the check sheet, the histogram, the Pareto chart, the cause-and-effect diagram, the scatter diagram, the control chart and stratification. They are the set Kaoru Ishikawa assembled in his Guide to Quality Control with a deliberate purpose: so that anyone on the floor, without advanced statistical training, could solve the majority of quality problems with seven simple instruments. ASQ itself notes that some more recent lists swap stratification for the flowchart, so if your plant runs a variant of the list, it is not wrong.
What the seven share matters more than how they differ: every one of them is a representation instrument. They take an existing set of data and arrange it so the human eye can find the signal. None of them goes out and measures. That is a virtue — it is why they are universal and cheap — and it is also their blind spot. A quality tool inherits the quality of its input without any filter.
In manufacturing that input tends to be good wherever the process measures it automatically (temperature, pressure, cycle counts, units per hour) and poor wherever it depends on someone walking over, looking and writing it down. The geometry of the building and its assets always falls in the second group. The cost of that asymmetry is documented: NIST put it at $15.8 billion a year in the U.S. capital facilities industry, caused by information that does not connect properly across systems and stakeholders — with two-thirds of that cost absorbed by owners and operators, mostly during operations and maintenance. That is not a software problem. It is the problem of nobody holding a measured version of reality.
None of this is an outside requirement somebody invented for you. The management system asks for it. ISO 9001 holds evidence-based decision making as one of its quality management principles, and requires organizations to determine and provide monitoring and measuring resources appropriate to the type of verification being performed. If what you are verifying is facility geometry, your appropriate measuring resource is not a tape measure.
Getting into 3D scanning: What a point cloud is, and why it qualifies as quality data
A point cloud is a record of millions of X, Y, Z coordinates captured by a terrestrial laser scanner that sweeps a space from several positions and measures the true distance to every surface it finds. The output is not a picture of the machine room: it is the machine room converted into measurements. If you want the technical detail of how it is generated and used, we cover it in our article on the point cloud in modern engineering.
Three properties make it usable as a quality input. The first is traceability: every point has a known position, so two different people read the same number. The second is accuracy — ±2 to 10 mm depending on the equipment and site conditions, tight enough to catch deviations that do not exist to the naked eye. The third is that the scanner is non-intrusive: the plant keeps producing while it is surveyed, with no scheduled shutdown and no need to enter hazardous zones.
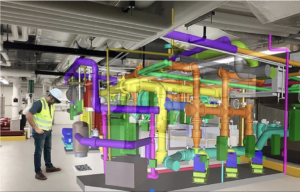
From there comes the comparison quality actually needs: as-designed against as-built. The first is what the project said would be built; the second is what ended up there after construction, after floor-level changes, and after fifteen years of interventions that never made it back to the drawings. Overlaying one on the other produces a deviation map — what moved, how much and in which direction — which is, literally, a geometric nonconformance report. It is the same deliverable we produce when we generate as-built plans and when we do BIM modeling with clash detection, before the clash exists in steel.
The 7 tools, one by one, fed with 3D scan data
The exercise below does not replace any tool. For each one: what it does, which piece of data it lacks when the problem is physical, and what the 3D capture contributes.
1. Check sheet: capturing without depending on the shift
The check sheet is the simple form where you record what happens and how often. Its known weakness is the person filling it in: different people interpret differently, entries get skipped under heavy load, and dimensional readings are taken with whatever instrument was at hand. A scan solves the geometric half of that problem by substitution. Instead of writing down twenty dimensions, you capture the whole area and extract the dimensions afterward — as many as you need, without going back to the floor. The check sheet stops being the source of dimensional data and goes back to recording what a person should record: events, conditions and process observations.
2. Histogram: seeing the real distribution of deviations
The histogram shows how often each value occurs and reveals whether a process is centered, skewed, or split into two populations. Applied to geometry it almost never gets built, because nobody has enough measurement points. With a point cloud you do: the deviation of a slab from its theoretical plane, point by point, is a complete distribution. That is where you see the difference between a floor sitting 8 mm low across the board — a levelling issue, fixable — and one with two zones behaving differently, which almost always points to differential settlement and is a different conversation entirely.
3. Pareto chart: prioritizing by evidence, not by complaint
The Pareto chart ranks causes from largest to smallest so effort concentrates on the few that explain most of the effect. The practical risk is that it gets built from reported incidents, and reporting is biased: people report what bothers them, not what costs most. A 3D survey lets you rank areas or assets by measured magnitude of deviation from the project. That is a Pareto of physical condition rather than perception, and it tends to reshuffle the year’s priorities. It is the logic behind the Werdhölzli water treatment plant project, where the team found out — as it started planning the modernization — that it had no updated engineering drawings for a facility with operating systems and subsystems stacked on top of each other.
4. Cause-and-effect diagram: filling in the “Measurement” branch
The Ishikawa diagram organizes the possible causes of an effect into branches — method, machine, material, manpower, measurement, environment — so a team can argue with structure. In practice two branches stay hypothetical: “machine” and “measurement.” Nobody confirms during the session whether the equipment base is level, whether the frame twisted, or whether the line ended up out of square, because checking means stopping and measuring. With the as-built model on hand, those hypotheses get resolved on screen during that same meeting. The diagram itself does not change. What changes is that the team leaves with causes ruled out instead of verification tasks assigned.
5. Scatter diagram: cross-referencing geometry against process
The scatter diagram relates two variables to see whether they move together. Its limitation is one of inputs: to plot anything against the physical condition of an asset, that condition has to exist as a number, and usually it does not. A scan produces it. From there you can cross measured deviation — flatness, plumb, alignment between runs — against the variables your process already logs, and observe whether a relationship shows up. One necessary caveat: correlation is not cause, and a 3D model does not prove the why on its own. What it does is let the question be asked with data on both axes instead of one.
6. Control chart: monitoring the building over time
The control chart plots a measure over time between control limits to separate normal variation from the kind that requires action. It is the most underused tool in the physical world, because it demands a series of repeated and comparable measurements, and a manual survey never is one. Periodic scans of the same asset are: they register against the same reference and compare directly against each other. That makes it possible to track settlement, progressive misalignment or racking deformation as a series, and to see the trend before it becomes an event. When that monitoring is combined with real-time operational data, the vehicle for it is a digital twin.
7. Stratification: separating what the average hides
Stratifying means splitting data by origin — shift, line, supplier, bay, level — so one average does not paper over two different realities. With an as-built model, stratification becomes close to automatic, because every measurement already carries its location: you can split by bay, structural grid, system or capture date without surveying anything again. In the Migros Millas project, with 11,000 m² documented, that was exactly the value — moving away from assessing the facility as one block and being able to coordinate with different suppliers over the portion each one owned, inside a single BIM environment. You can review that and other work in our projects and case studies.
How far 3D scanning goes
Drawing the line is part of the proposition. A terrestrial laser survey measures the geometry of facilities and assets: building, structure, piping, ducts, equipment, layout. It is not part metrology. If your quality control needs to verify manufacturing tolerances on a component, the right tool is still a coordinate measuring machine or a measuring arm, not a plant scanner. Those are different scales and they are better kept apart.
It also does not measure anything that is not shape. A scan does not record temperature, vibration, pressure or power draw. Your instrumentation produces those, and the place where it makes sense to bring them together is a digital twin that combines the geometric model with operational data. And it does not replace your document management system or your eQMS — it feeds them. If what you are evaluating is the quality software layer (document control, digital inspection, analytics), see our overview of the most effective digital quality tools, which covers that part. This article covers the layer underneath it: where the physical data those platforms administer actually comes from.
What this looks like the first time in your plant
Our Scan to BIM process runs in four stages: on-site capture and registration, modeling from the point cloud, validation by overlaying the model against the cloud, and delivery. Timelines depend on scope — a small project takes about a week, a complex industrial bay three to five. Delivery includes native editable files (RVT, PLA), drawings generated from the model, and free viewers so anyone on your team can open the project without a license. It does not lock you in with us.
And you do not start with the whole plant. Quite the opposite: capturing everything at maximum level of detail is the expensive, slow route, and it ends with an enormous model nobody uses. You start with the area where not knowing costs the most — the line you are about to modify, the machine room, the zone with recurring nonconformances — and the model grows at the pace of your actual interventions. Defining that, along with which decision it has to resolve and at what level of detail, is the first conversation. It is the same sequence we followed across the three plants in our Scan2BIM in manufacturing case studies.
There is a simple signal for whether this applies to you. If someone in your last quality review said “we should go verify that on the floor” and the task is still open, your quality tools are waiting on data nobody has captured. That is exactly the gap a point cloud fills: it turns the pending verification into measured certainty, available before the next meeting.
Tell us which area of your plant keeps you up at night and we will run the as-designed versus as-built comparison on that zone, so you see the deviation measured rather than estimated. Request your point cloud quality control demo here.