Scan2BIM in manufacturing: 3 cases where real data changed operations
Scan2BIM delivers results in manufacturing when it replaces assumptions with measured geometry: the plant is captured with a 3D laser scanner, what is actually built is modeled in BIM, and the expansion, the modernization or the maintenance plan is built on that base instead of on an inherited drawing. In the three projects reviewed here (Früh Verpackungstechnik AG, the Werdhölzli treatment plant and Migros Millas) the underlying change was the same: they stopped designing on information that no longer matched the facility.
The urgency does not come from BIM, it comes from production. Siemens’ The True Cost of Downtime 2024 report calculates that the world’s 500 largest companies lose 11% of their annual revenue to unplanned downtime, and that an average large plant stops producing for 27 hours a month. Every hour of a poorly planned intervention is paid against that same clock. On top of a faithful capture of the space, at Foundtech we report up to 35% fewer reworks, 25% shorter execution times and 22% higher operational efficiency.
A 7-minute read. By the end you will know what problem the scan solved in each case, which deliverable solved it, and how to tell whether your plant is ready to be captured.
No plant stops because it lacks drawings. It stops because the crew opened a wall where the drawing said there was nothing, because the new line missed by the forty centimeters nobody measured, or because the imported equipment collides with a duct that is still in service and appears in no file. That cost is not booked as a documentation error: it is booked as downtime, as rework, and as a start-up date that slipped two months. The operational question, then, is not whether 3D scanning works: it is what exactly changes in a plant that is already producing.
At Foundtech we reverse that sequence: first we capture the reality of the facility with millimeter precision, then it gets designed. We do not model from memory or redraw old plans; we model the point cloud of what stands there today. That is how we have worked on more than 200 projects across Europe and the Americas, with 10 million m² modeled under ISO 19650 certification and alongside our European sister company BIM Facility. Which is why this article does not argue from theory: it argues from three projects already published in our case studies —a packaging factory, a process plant and an 11,000 m² facility in operation— and from what each one solved.
What it costs to run a plant on drawings that no longer match
Every operating plant drifts away from its own documentation. A line that was moved, a panel that was added, a pipe rerouted to clear a new machine: each change is executed on the floor and almost never makes it back to the drawing. Ten years in, the real plant and the documented plant are two different buildings, and the second one is what gets used to price the expansion. NIST put a number on that friction: $15.8 billion a year in costs caused by information that does not flow well between systems and stakeholders in the capital facilities industry, with two thirds of that cost absorbed by owners and operators, largely during operations and maintenance.
In manufacturing that cost turns into idle line hours. According to the same Siemens report, the Fortune Global 500 loses close to $1.4 trillion a year to unplanned downtime —11% of revenue— and the average large plant loses 27 production hours a month, even after coming down from 39 hours in 2019. It is worth being precise about what a scan does and what it does not: a BIM model will not stop a motor from failing. What it removes is the other source of downtime, the avoidable one —the kind that comes from intervening in a space nobody knows exactly. That is where Scan to BIM changes the equation: it turns a job full of assumptions into a job with verified geometry.
Case 1 · Früh Verpackungstechnik AG: expanding production without data or time
Früh Verpackungstechnik AG manufactures flexible packaging solutions for medical and pharmaceutical products in Switzerland. As operations grew, the company needed a major expansion of its production space, and hit the wall every expanding plant hits: it had neither quality information about its facilities nor enough time to survey them the traditional way. Both at once. That is the real bottleneck of an industrial expansion —not the design, but the starting point.
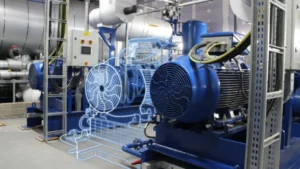
We recorded the facilities through point-cloud laser scanning and modeled them in detail in Revit until we had a digital twin with the required “as built” characteristics, and the new planning started from there —not from an archived drawing. The result the case reports is an expansion project built on real physical asset information, with a more efficient action plan that translated into savings in time, cost and maintenance across the building’s entire life cycle.
What changed in operations: the as-built stopped being a closeout formality and became the input of the design. When the architect and the process engineer work on the point cloud, the “will it fit or not” argument is settled on screen, weeks before anyone books a crane. The full project record is in the Früh case study.
Case 2 · Werdhölzli: modernizing a complex plant with no updated engineering
The Werdhölzli wastewater treatment plant, in Switzerland, found the problem late: as it began planning its modernization, the team realized it had neither updated drawings nor updated engineering. The construction is highly complex —operating systems and subsystems stacked in the same space— and a traditional survey would have taken so long that valuable opportunities would have been lost. The constraint was not budget: it was the calendar.
We scanned the plant to generate a navigable 3D viewer —the equivalent of a Street View of the facility— and modeled every operating system and subsystem: piping, tanks, structures. With that, the architects and engineers running the executive project stopped reconstructing the plant from memory. The modernization was planned and executed with significant savings in time and cost, and the digital twin remained available for what came next: maintenance, logistics and asset management.
What changed in operations: the survey stopped being a single-use expense. That is the most underrated economic argument for Scan2BIM in a process plant —you scan once and the capture serves the executive project, the coordination BIM model, and years later the planning of a shutdown without guessing where each line runs. It is the same logic we apply when planning scheduled shutdowns with digital twins.
Case 3 · Migros Millas: 11,000 m² documented to operate, not to build
Migros Millas did not come looking for a construction project. It came because the quality of its products depends on its facilities, and it needed to improve the maintenance and the design of those facilities without having the documentation —drawings, installations, engineering— or a tool that would let it assess its current situation and coordinate with its different suppliers in a BIM environment. This is the case closest to a plant that will not grow this year, but can no longer keep operating blind.
Working closely with our sister company BIM Facility AG, we started where it should be started: a strategic analysis to define the technical scope of the digital twin and a sound ROI. Then came the survey of the facilities —interior scans and drone shots, at a detailed level— until every pipe route and every electrical installation was understood. The benefits reported in the Migros case study are operational rather than constructional: faster decisions when something unexpected happens because the information is current, minimized risk through understanding of the space, and time and cost savings in both maintenance and the expansion projects that followed.
What changed in operations: the order of the work. First they defined what was worth modeling and at what level of detail; then they scanned. It sounds obvious and almost nobody does it. The opposite route is the one we have seen fail: the whole plant gets captured at maximum level of detail, the model arrives enormous, and the team ends up using a fraction of it, because nobody defined beforehand which decision it had to answer. Scanning everything at maximum detail is expensive and slow; scanning what is critical at the right level is what gives the project a return. If your priority is operational rather than constructional, the deliverable that usually solves it fastest is updated as-built plans, with the model built on top.
The pattern that repeats across the three cases
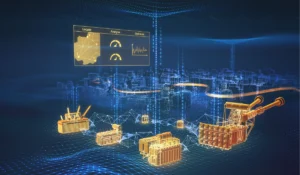
Three different sectors, three different goals and one shared starting point: the facility existed, it was running, and nobody had reliable geometry for it. In all three, the scan was not the project —it was what made the project possible. And in all three, the captured data kept working long after the job was finished. That is the useful takeaway for a plant director: Scan2BIM does not compete with your construction budget, it determines how reliable that budget is before you sign it.
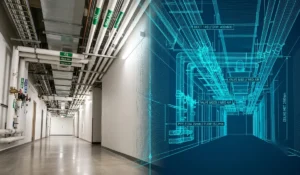
The execution is no mystery either. Our Scan to BIM process runs in four stages —on-site capture and registration, modeling from the point cloud, validation by overlaying model against cloud, and delivery— with terrestrial scanners accurate to ±2 to 10 mm depending on equipment and conditions. The equipment is non-intrusive: the plant keeps running while it is being captured. And the handover does not lock you in: editable native files (RVT, PLA), drawings generated from the model, and free viewers so anyone on your team can review the project without a license. On timing, a small project takes about a week and a complex industrial building three to five.
The market oversells Scan2BIM, so let us mark the limit. It is not predictive maintenance and it does not replace your maintenance management system: it is the layer of certainty that makes those systems trustworthy. It is not a rendering either. As Autodesk explains about the Scan to BIM methodology, the value lies in a model that inherits measured existing conditions rather than interpreted ones. If the goal is to rearrange flow and space more than to build, that same input is what we use to rethink the layout of a logistics warehouse.
How to tell whether your plant is ready for a scan
Three signals showed up in all three cases, and you are probably seeing them already. First: your last expansion was resolved with measurements taken by hand on site and there were still adjustments during construction. Second: when a supplier asks for updated drawings, someone has to go verify on the floor before sending them. Third: there is at least one area of the plant nobody wants to touch because no one knows for certain what runs through it. If two of the three sound familiar, this is no longer a documentation problem: it is operational risk.
And you do not have to start with the whole plant. You start with the area where not knowing costs the most —the expansion zone, the machine room, the line you are about to retrofit— and from there the model grows at the pace of your real interventions. That prioritization is exactly the first conversation we have with you. Tell us which area of your plant keeps you up at night and book a diagnosis of your project here.